Intro![]()
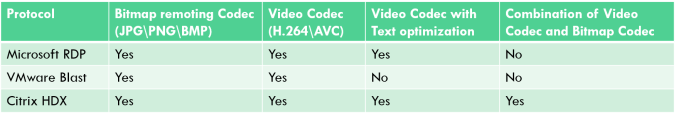
As you might know the RDP protocol in Windows 10 consists of different type of codecs (both proprietary and standardized video compression codecs). They belong to a broader set of technologies also known as RemoteFX. There are currently 2 type of codec configurations possible in Windows 10:
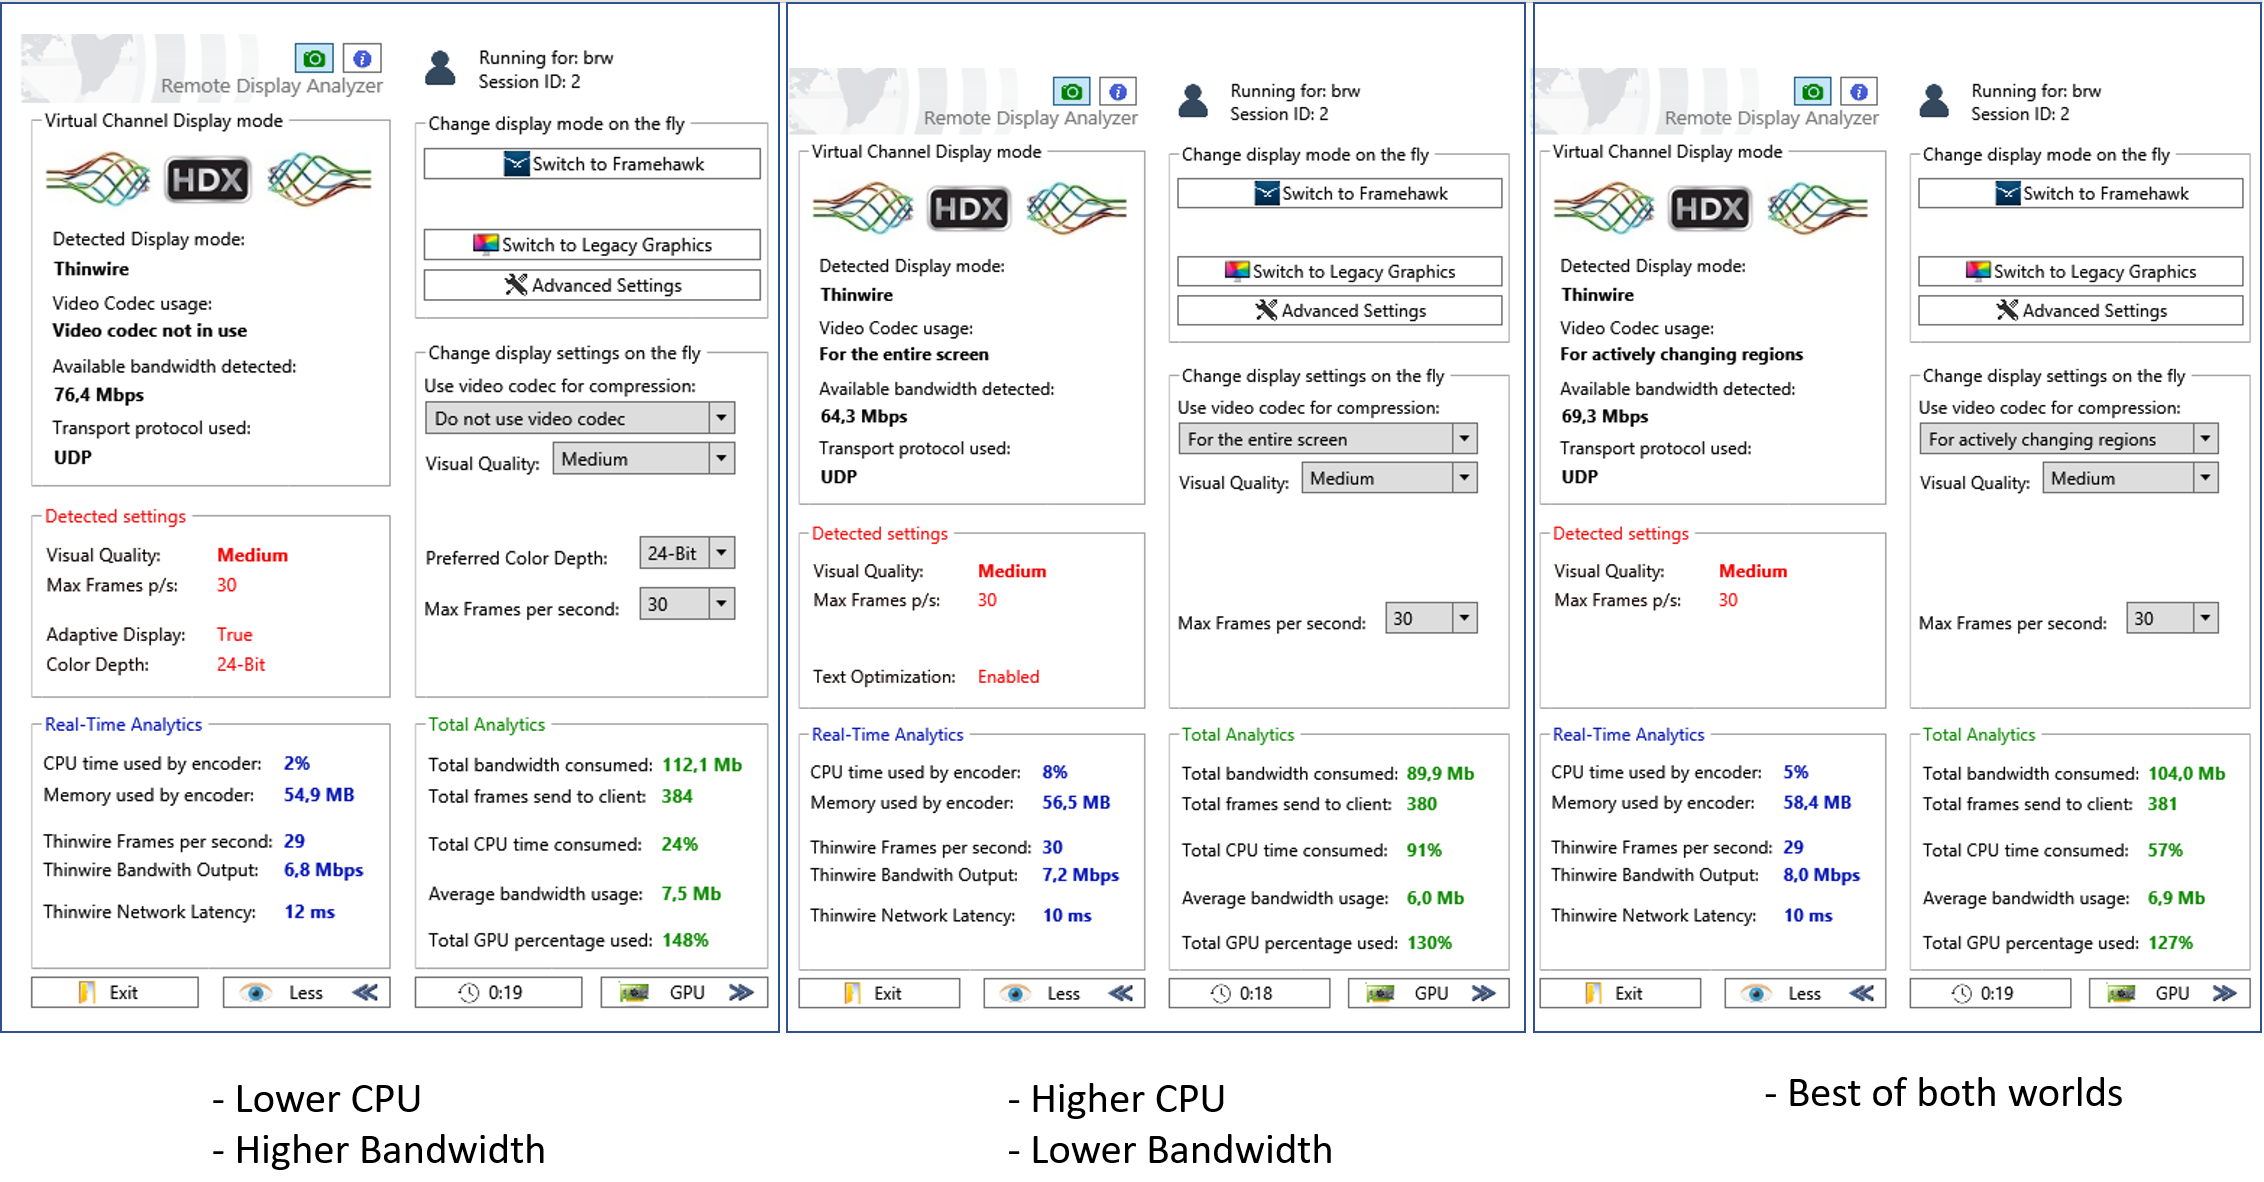
- A combination of different codecs, one optimized for text and one for moving graphics (like video content)
- The full screen AVC video codec
You can configure them with policies and check which configuration you are using by checking Event ID 162 in the following eventlog location:
Applications and Services Logs -> Microsoft -> Windows -> RemoteDesktopServices-RdpCoreTS -> Operational
- Initial profile 2 means you are using the codec combination
- Initial profile 2048 means you are using the full screen AVC codec
Both configurations gives a good out-of-the-box experience with a high level of quality. The full screen AVC codec implementation is pretty neat because they managed to leverage hardware encoders that normally only supports 4:2:0 encoding to reach a 4:4:4 quality level. While 4:2:0 compression is ideal for video content, 4:4:4 quality is needed to make text and still images sharp without blurry side affects. The full screen AVC codec implementation operates best when encoding can be done in hardware (GPU), it can however work with software based encoding (emulated GPU) but that will result in increased CPU utilization. Good to know is that the new HTML5 based web client always leverages the full screen AVC codec implementation.
(v)GPU
You might have heard that RemoteFX vGPU has been deprecated in Server 2019. Times have changed and GPU virtualization technologies have matured making the API intercept based technologies (like RemoteFX vGPU was) a legacy technology. But no need to get sad about this, because we will get something nice in return: GPU Partitioning or GPU-P for short. It’s still under development but sounds very promising. With this technology multiple virtual machines can leverage the GPU directly (even load balance across multiple GPU’s) and by leveraging the GPU directly Microsoft can move away from the man in the middle role where they needed to maintain the API intercept driver to support new graphic standards. For now we can only leverage the GPU directly by using DDA (GPU pass through) or use GPU virtualization technologies from other vendors.
Windows Virtual Desktop (WVD)
The new GPU-P technology also opens the door for Microsoft to implement this on Azure, which would be a very welcome feature for WVD (the new RDS infrastructure and multi-session Windows 10 edition hosted on Azure). Hopefully Microsoft will not be supporting the GPU-P technology only in Azure like they do with the new multi-session Windows 10 for WVD edition, this will really isolate this technology preventing broader use cases. I don’t think they will be doing this because they pull away RemoteFX vGPU and should provide an alternative for it.
What happened in a year time with the RDP protocol
With almost every new Windows 10 build the RDP graphics stack is updated, there is not much information you can find about such improvements, but they are certainly there.
While doing some investigation on different Windows 10 builds I noticed the protocol version is matched with the client to enable support for the latest features (both client and servers side). You can find this version numbers in the same eventlog as described in the intro. They look like this:
The client supports version 0xA0400 of the RDP graphics protocol (Build 1709)
The client supports version 0xA0600 of the RDP graphics protocol (Build 1809)
Some of the improvements in the RDP protocol are:
- Screen regions and content are better classified (to make optimal use of the right codec and compression algorithm)
- Webcam redirection improvements leveraging H.264
- Down-scaling for 4K resolutions
- GPU-P technology (announced) the AVC codec will also benefit from this
Time for a test!
I decided to do a simple test using Remote Display Analyzer to look at the improvements and changes Microsoft made to the RDP protocol in a year time. To do this I used 2 different Windows 10 builds: The 1709 and 1809 build (without updates) this will give more a less an indication of the improvements in a year time frame.
Remote Display Analyzer now also supports WVD, but I did not use it in this test because the current WVD private preview only has its RD gateways in the US and it doesn’t make much sense to let traffic flow across the globe. Will do some more testing with WVD later when it’s GA. To check the differences in the RDP protocol between the Windows 10 builds I performed the following test:
- A direct RDP connection to both builds
- Connection over LAN using a Windows 10 1809 client
- Used the out-of-the-box RDP configuration on both builds
- Both builds running on the same infrastructure
- The test consists of playing a short video (not full screen) and scrolling some text. Exactly the same has been done on both builds
- Please note that this was a manual test and it’s always better to automate such tests (I recommend REX analytics for this)
- This results come without warranty of any kind and are based on my own observations using my own infrastructure. This is only to give you an indication of the differences I observed while performing this test
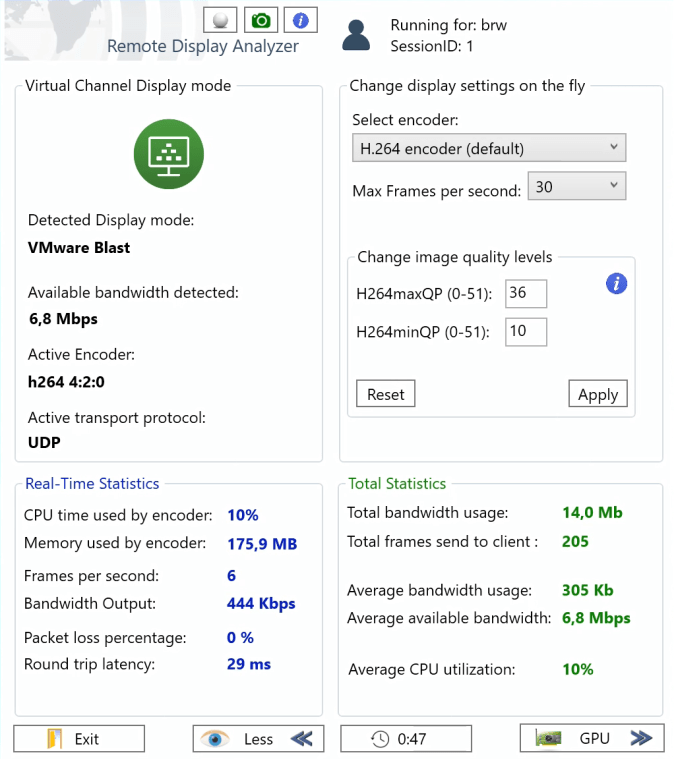
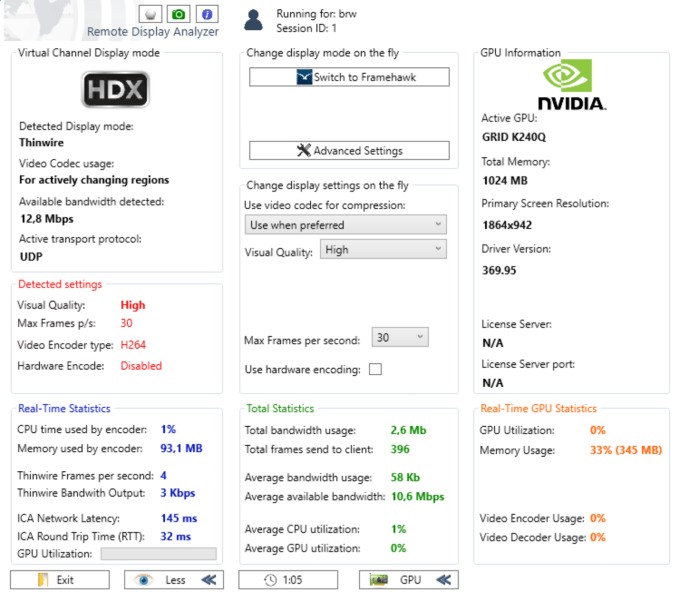
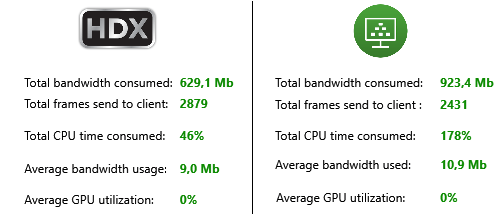
The results are below:

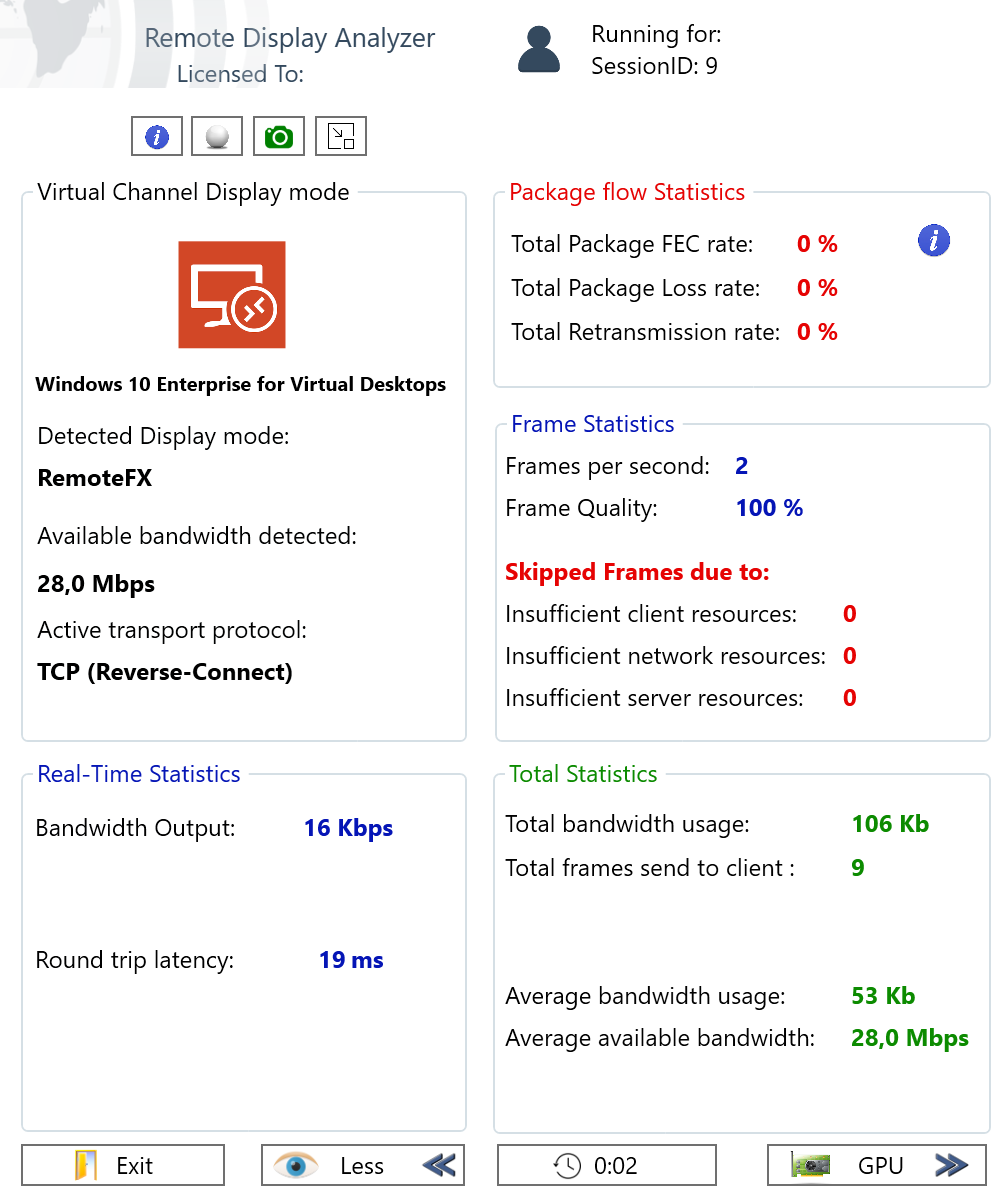
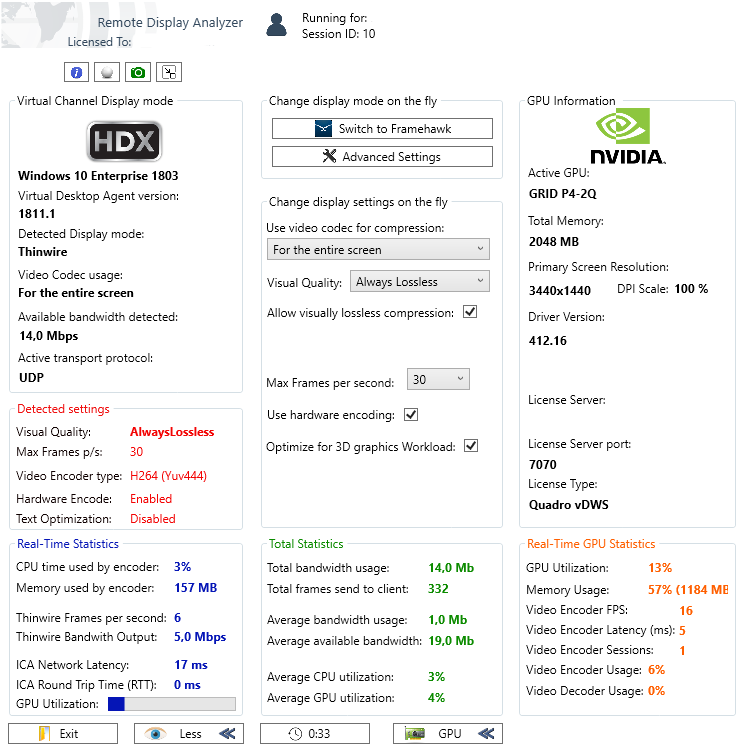
On the left you see the results of running the test on the 1709 build and on the right the results of running the exact same test on the 1809 build. I observed the following:
- The 1809 build used less bandwidth (almost half) while I didn’t perceived a noticeable difference in frame quality. The send frames are more or less identical
- The reported “available bandwidth detected” is different across the builds, I’m not sure what the reason for this is, the value of this counter looks a bit inconsistent so I’m not relying to much on this one
- Overall my perceived user experience on the 1809 build was better (more fluid and snappier screen updates)
Conclusion
While you don’t hear much about it, Microsoft still makes improvements in their remote graphics stack and they should be doing this because it’s one of the most critical success factors of the upcoming WVD platform. The 1809 build performed much better on the LAN then the 1709 build, the lower bandwidth is also great news for WAN scenarios. I’m expecting more protocol improvements inline or shortly after the WVD release, I will certainly keep an eye out on this and will write a new blog post when more information is (publicly) available. Thanks for reading!


 MSIX: The platform for all Windows applications