(Current version 1.3) (update 07-09-2024), this blogpost contains all updates to keep everything consolidated.
I created a tool for RDS, AVD and Windows365 environments that notifies users about changes in the user experience. It is called the Connection Experience Indicator. This tool does the following:
- Support users by pointing out issues that affects the user experience
- Reduce the number of help desk calls related to user experience issues
- Show notifications about the latency to the virtual desktop. Notify when the latency is good and warn when latency is high or very high
- Show notifications about the available bandwidth. Notify when the available bandwidth is good and warn when the available bandwidth is weak or poor
- Integrated in the Windows 10 & 11 notification center
- Integrated in the taskbar and when you click on the icon a small window will be shown that provides real-time information about the connection to the virtual desktop
- Single exe (no installation required) can be easily started with login script or other mechanism
- The tool can be configured with parameters so it can be adjusted to your environment (please find all settings below)
- Log connection changes in event viewer so they can be used to analyze in, for example, Azure log analytics
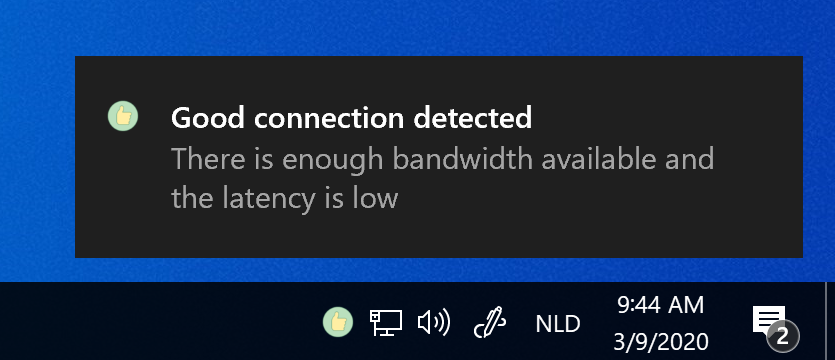
When the Connection Experience Indicator starts it will notify the user about the connection to the virtual desktop:
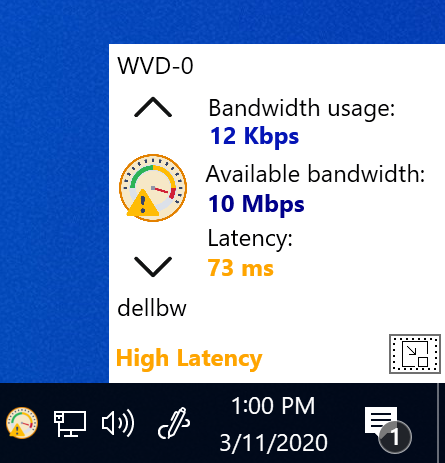
When you click on the icon you will see the client name, the virtual desktop name and real-time information about the connection:

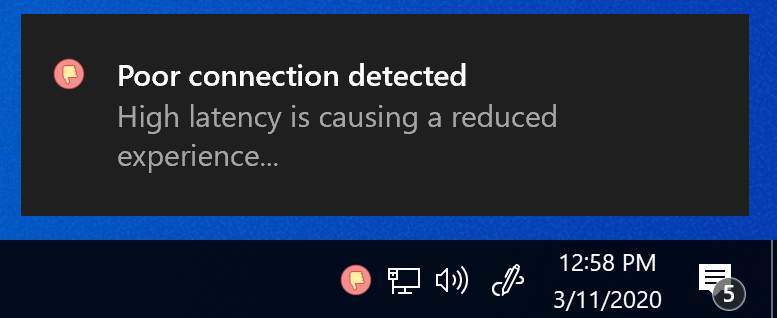
When the latency or available bandwidth is below the default or configured thresholds the user will be notified that the user experience might be affected:

The taskbar icon is changed and when you click on the icon you will see that the connection state has changed:
When users are in areas with poor internet conditions (hotels \ public WiFi, etc), the user gets notified that the user experience is affected:
Clicking on the icon will reveal a very high latency which is causing a reduced experience:

You can also change the window to transparent mode by clicking in the window. This will allow the window to run on top without being intrusive on the screen:
![]()
You can also drag the window around and place it somewhere else on the screen.
The Connection Experience Indicator can be configured with parameters so you can adjust it to your own environment and preferences. But please note that you don’t have to configure parameters, if a parameter is not provided it runs with the default values:
| Parameter | Use case | Default value |
| -pb | The poor available bandwidth threshold (Mbps). When this threshold is reached a poor connection notification is shown. | 2 |
| -pl | The poor latency threshold (ms). When this threshold is reached a poor connection notification is shown. | 150 |
| -wb | The weak available bandwidth threshold (Mbps). When this threshold is reached a weak connection notification is shown. | 5 |
| -wl | The weak latency threshold (ms). When this threshold is reached a weak connection notification is shown. | 75 |
| -measureinterval | The time interval that thresholds are measured and real-time information is updated (in seconds) | 5 |
| -shownotifications | Enable\Disable if notifications are displayed to the user | True |
| -timetoshownotification | The time a notification will be displayed before it disappears (in seconds) | 10 |
| -timebetweennotifications | The time between notifications, a notification is always displayed when the connection state changes. If the state doesn’t change a notification will be displayed every x period to update the user about the connection state | 3600 (1 hour) |
| -transparent | Configure if the window will open in transparent mode by default | False |
Example:
ExperienceIndicator.exe -pb 5 -wb 10 -pl 175 -wl 100 -transparent true
Logging is automatically enabled and can be disabled by adding the -log false parameter.
The Connection Experience Indicator is provided as community tool for free without warranty of any kind.
Note for (Enterprise) customers that are in need for a supported version:
It’s possible to request a company license for Remote Display Analyzer this also includes support for the Connection Experience Indicator.
Please click here to download the latest version of the Connection Experience Indicator.
Release notes:
1.1 : Initial release
1.2: Fixed an issue that could cause high CPU usage when the session was disconnected or locked, the session state detection has been improved, added support for other (native installed) OS languages, executable is now signed with correct timestamp
1.3: Multiple fixes and improvements, new logging feature to submit connection state changes to the eventlog
