Comparison between display settings in Citrix HDX

Hi everybody,

Last Citrix Synergy (2017) in Orlando, Benny Tritsch and Ruben Spruijt presented the following session:

SYN303: Independent Citrix experts deep dive on Remote Graphics, user experience and GPUs.
This session was among the top 10 of most popular sessions of Synergy 2017, if you didn’t see the presentation you can watch it on-demand here.

In this presentation the new Remote Display Analyzer (RDA) version 1.6 was announced which will be released soon. This version includes numerous new features like a screen capture button and a GPU add-on (available for all display protocols Remote Display Analyzer supports). More about this new RDA version soon.

Also shown in this presentation where the results of a short comparison between 3 major display settings currently available in Citrix HDX. In this blogpost I will show you how this comparison was made together with some key findings. The display settings where evaluated in real-time by playing the exact same video three times while live switching between the following settings:

  • Video codec not in use
  • Video codec for the Entire screen
  • Video codec for Actively changing regions

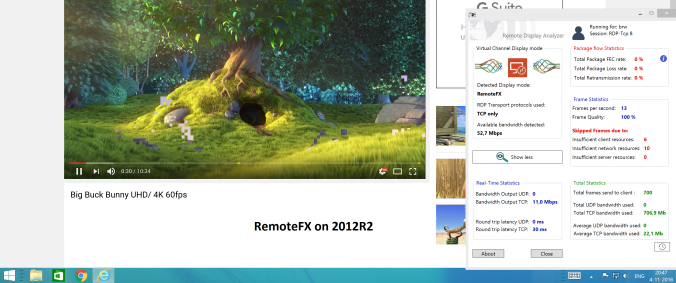
You can watch the comparison here:

(Test video source: Aswanth Mohan (www.youtube.com/watch?v=668nUCeBHyY))

The result of each setting is shown below:

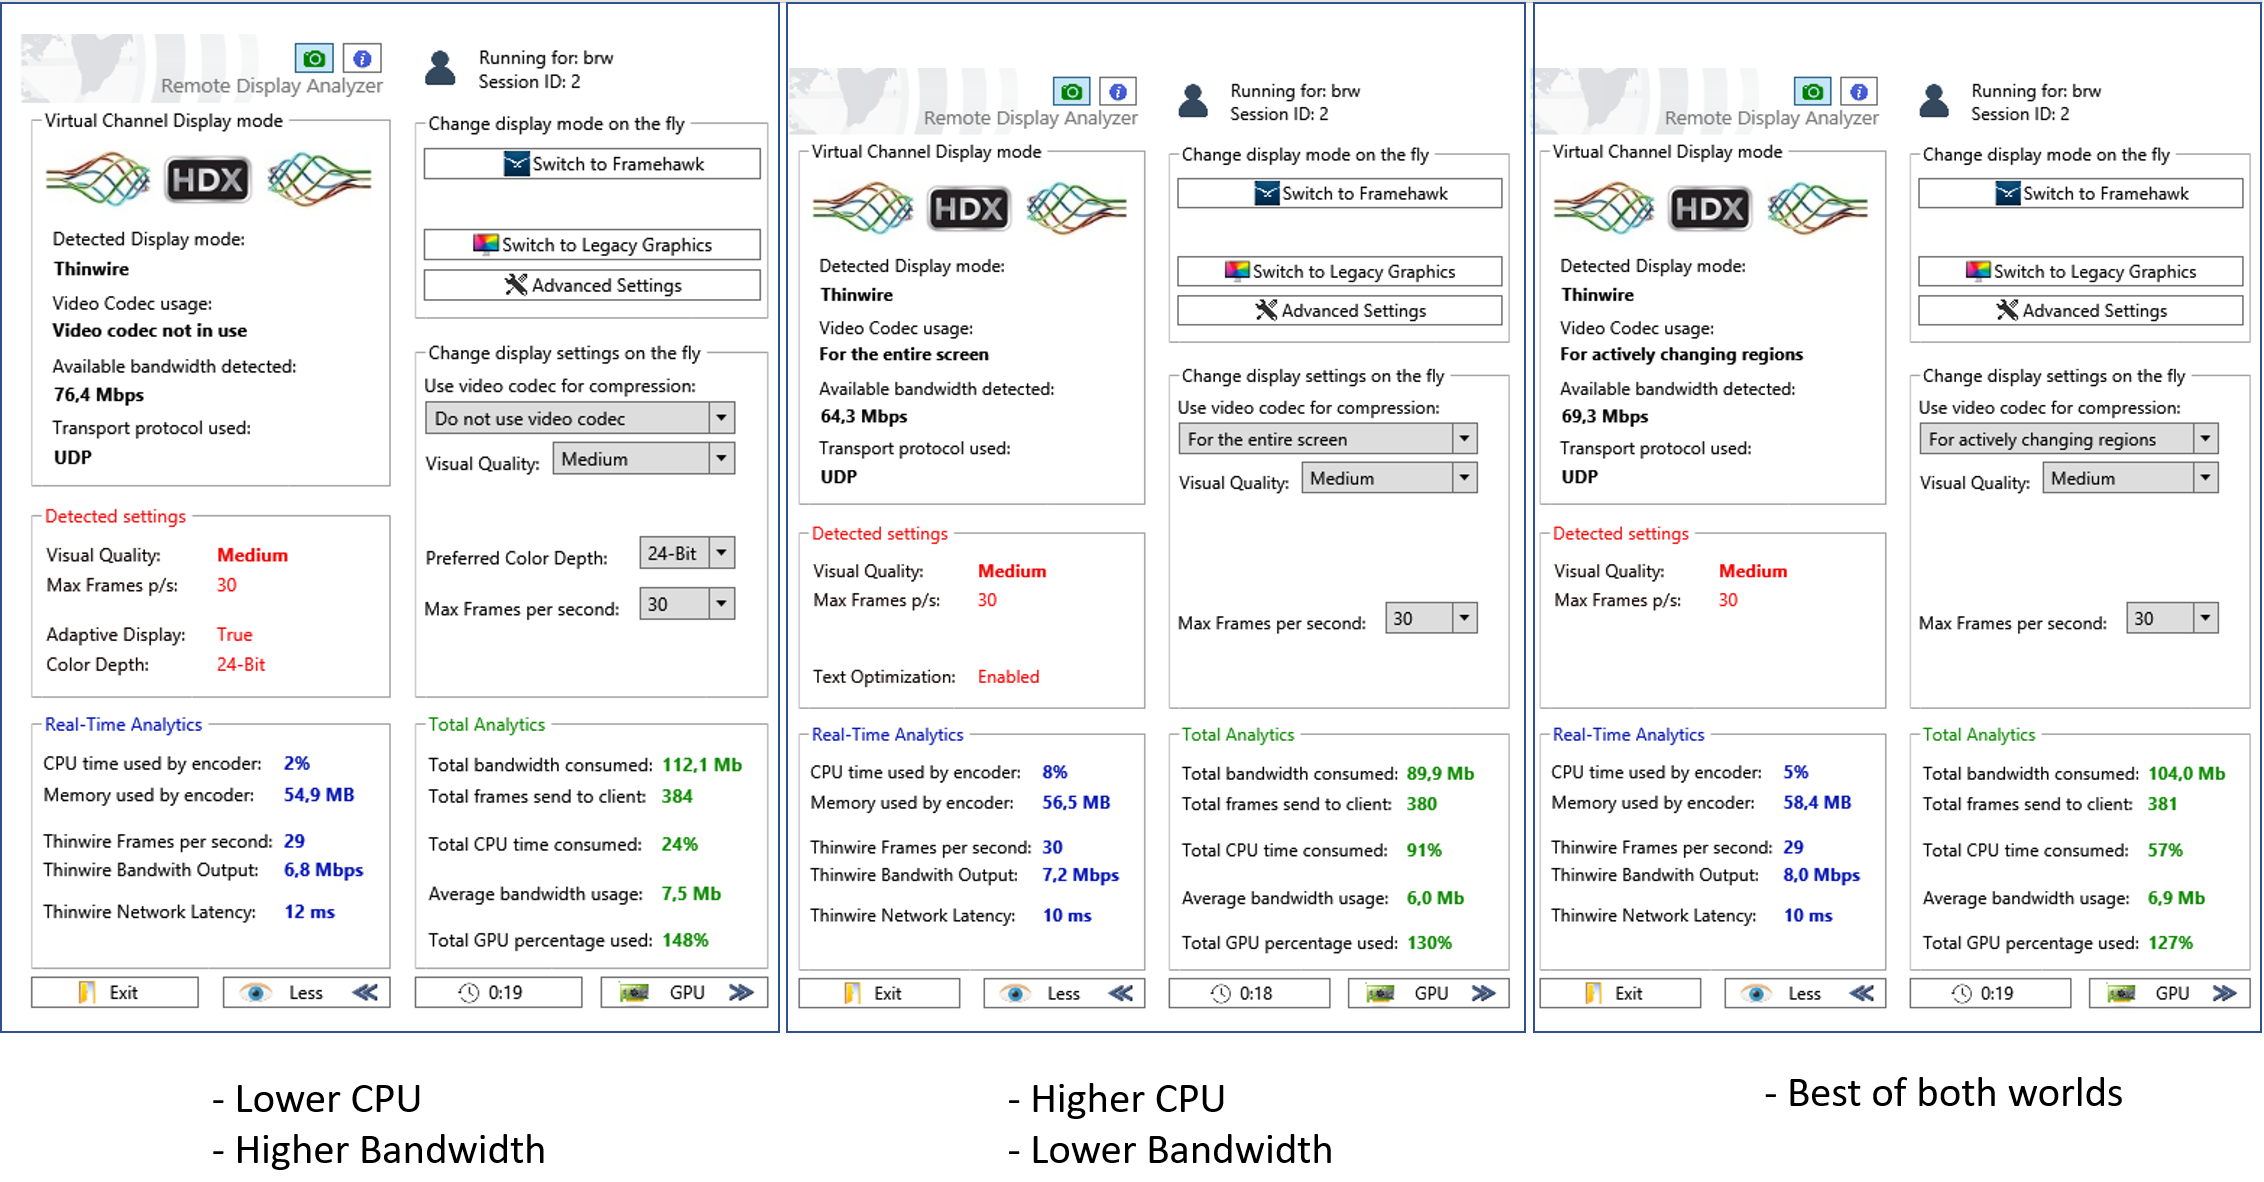
Some key findings from this short comparison:

  • The total send frames where nearly the same
  • During the test I noticed no big difference in user experience while playing this short 720p HD video
  • Video codec not in use has the lowest impact on CPU but as you can see the bandwidth consumption is higher then the other two
  • Video codec used for the entire screen (with text optimization) gives the best result on bandwidth consumption, but this comes with a higher CPU usage
  • Video codec used for Actively changing regions results in a very good balance between both CPU and bandwidth consumption

Disclaimer:
Please note that this results come without warranty of any kind and are my own interpretation based on above test. The results may vary based on factors like workload, bandwidth and the infrastructure you are using. Please always test settings in your own environment to decide which configuration fits best in your scenario.

Remote Display Analyzer for RDP

rdp-icon

Remote Display Analyzer for RDP \ RemoteFX

If you are reading about Remote Display Analyzer (RDA) for the first time, RDA is a real-time monitoring tool which helps you:

  • Better understand remote display protocol behaviour
  • Troubleshoot remote display issues
  • Analyze and compare workloads across different display modes
  • Decide which settings works best in your environment

Remote Display Analyzer runs as single executable (no installation required) and docks on the buttom right corner of your session. The first release of Remote Display Analyzer was targeted for Citrix HDX, you can read more about this release here.

Today I’m happy to announce the availability of Remote Display Analyzer for RDP. Below you will find a screenshot of RDA for RDP in action:

printscreen
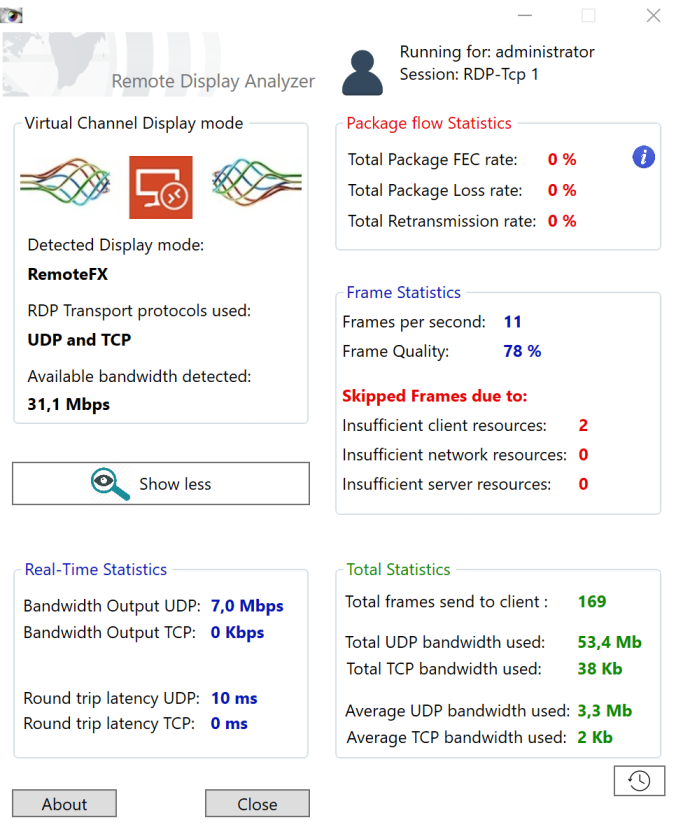
To give a short introduction I will shortly describe the available information in Remote Display Analyzer (RDA) for RDP:

Display Mode
RDA will detect the active display mode (RemoteFX or legacy RDP) and which transport protocol is used for the connection. RDA will also show you the available bandwidth, this is the measured available bandwidth between the client and the RDS session host.

Real-Time Statistics
The real-time statistics gives you visibility in the real-time bandwidth consumption for both UDP and TCP, also the round trip latency for the active protocol is shown here. 

Package flow statistics
This statistics are primarily used for UDP based connections and will show you the Forward Error Correction (FEC) rate (recover from losses without retransmissions) and the package loss and retransmission rate.

Frame statistics
Frame statistics will show you the number of frames currently being sent to the client, also the frame quality is shown here. You will get a better understanding how RemoteFX is adjusting the frame quality when playing video content for example. Also in case of any skipped frames, you will see how many frames are skipped and the reason why they where skipped.

Total Statistics
The total statistics section will show you the total analytics during the runtime of RDA. For example here you can find the total number of frames that where send to the client and the total amount of bandwidth consumed for each protocol. Also the average bandwidth consumption is shown here. Just run your workload and see in real-time and in totals how the active display mode behaves in your environment. The total statistics can be reset with the little button just below the total section.

Comparision between RemoteFX in 2012R2 and 2016

Just to show you an example, I compared the difference between RemoteFX in 2012R2 and 2016. The following information is part of this comparision:

  • Same workload (play 30 seconds of the same video)
  • Same datacenter
  • Same hardware
  • Same available bandwidth
  • Same client (connected to a 50Mbit internet connection)
  • Latest RDP client (Windows 10)

Below you will find a screenshot of the results after running the test on 2012R2 :

2012r2

And below you will find the screenshot after running exact the same test on 2016:

2016

Conclusion and findings

  • As you can see in the RDA output from above screenshots the total frames send to the client are more or less the same
  • You can also see that the consumed bandwidth is much lower on the 2016 session host
  • Average bandwidth usage is also much lower on the 2016 session host
  • Frame quality is more adjusted on the 2016 session host while playing video, but this has no noticeable impact on the user experience
  • Much more pleasant to watch the video on the 2016 session host

Please keep in mind this results are tight to this given scenario, results may vary depending on the workload and available resources.

Availability
Remote Display Analyzer for RDP is now available on the Remote Display Analyzer website, where you can also find more information about the project.

Currently the roadmap for the next version of Remote Display Analyzer is to add support for VMware (so all major platforms are supported) and to add GPU related information. Also Remote Display Analyzer will be consolidated into a single version so you can run it cross platform by just using one executable.

Thanks for reading!